Wind Profilers
Overview
A wind profiler is a type of equipment used to observe upper-air wind speed/direction. These units emit radio waves, which are scattered as a result of turbulent atmospheric density. The frequency of returning waves is shifted due to the movement of the scattering air mass (i.e., the Doppler effect), allowing analysis to determine wind direction/speed. Radio waves are radiated upward in five directions, allowing observation of wind components on a three-dimensional basis.
The Japan Meteorological Agency (JMA) has been conducting wind profiler observation since April 2001. At present, a nationwide network of 33 wind profilers is in operation. Observation data from the relevant sites are collected in real time at the central monitoring station of JMA headquarters for prediction (supporting the provision of precise weather forecasts) and other purposes. This comprehensive system of instruments and processing servers is collectively referred to as the Local Weather Monitoring System, or WINDAS (the WInd profiler Network and Data Acquisition System).
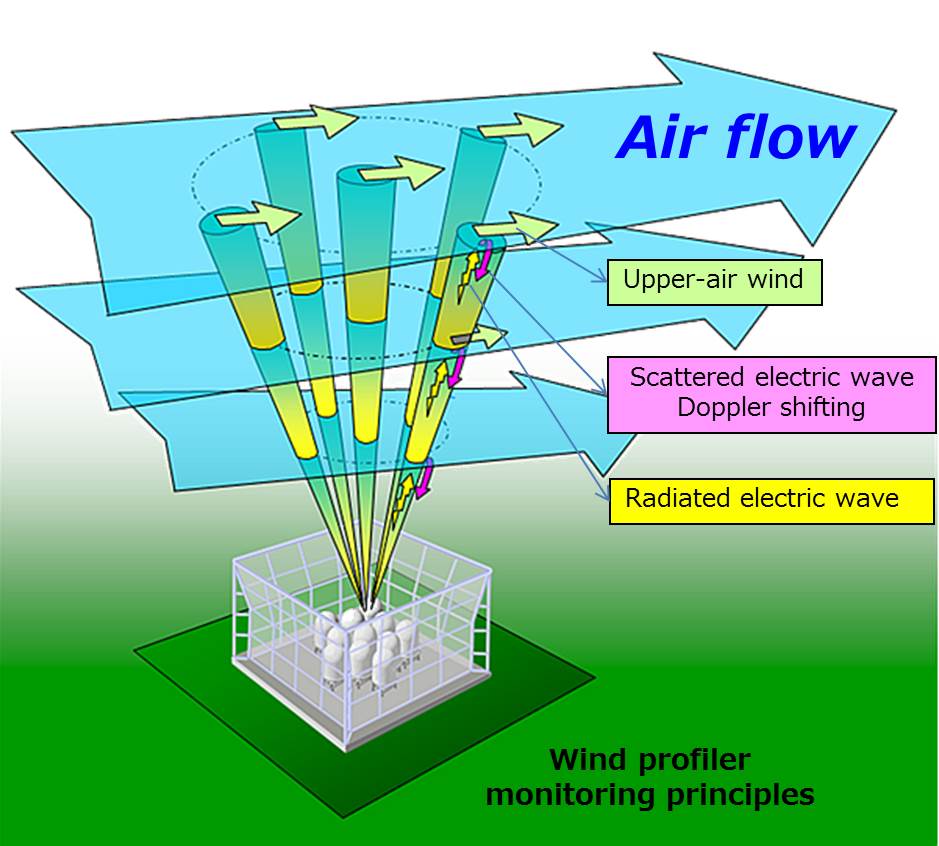
Wind profiler monitoring principles
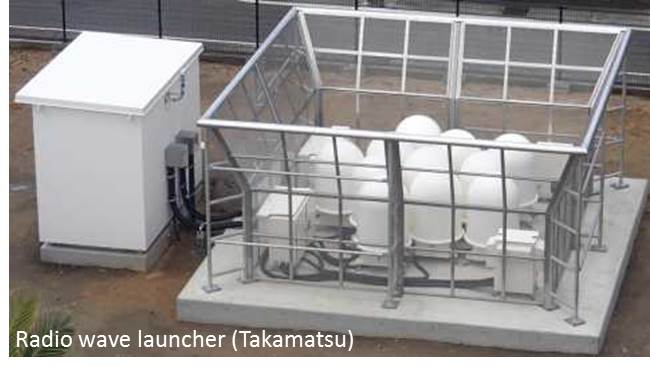
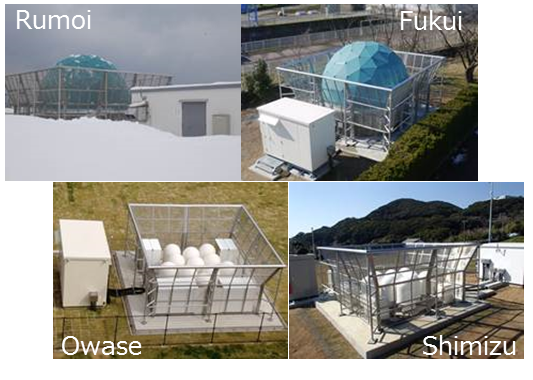
Wind profiler observation stations
These images show wind profiler stations. Antennas in snowy districts are covered with snow domes.
Observation Data
Wind profilers are used to observe upper-air wind at altitude intervals of 300 m every 10 minutes. Wind direction/speed is observed up to altitudes of 12 km from the surface (depending on weather conditions).
Wind profilers observe the movement of raindrops, which scatter radio waves more than atmospheric turbulence. Wind direction/speed can also be observed as raindrops are blown by wind. The vertical speed of raindrops is taken as their falling velocity.
Wind Profiler Observation Sites
| Region ID | Station | Location | Latitude (degree) |
Longitude (degree) |
Altitude (m) |
|---|---|---|---|---|---|
| 47406 | Rumoi | Rumoi-shi, Hokkaido | 43°56.8′ | 141°37.9′ | 23 |
| 47417 | Obihiro | Obihiro-shi, Hokkaido | 42°55.3′ | 143°12.7′ | 38 |
| 47423 | Muroran | Muroran-shi, Hokkaido | 42°19.4′ | 140°58.2′ | 3 |
| 47585 | Miyako | Miyako-shi, Iwate | 39°38.8′ | 141°58.0′ | 43 |
| 47587 | Sakata | Sakata-shi, Yamagata | 38°54.5′ | 139°50.6′ | 3 |
| 47590 | Sendai | Sendai-shi, Miyagi | 38°15.7′ | 140°53.8′ | 39 |
| 47570 | Wakamatsu | Aizuwakamatsu-shi, Fukushima | 37°29.3′ | 139°54.6′ | 212 |
| 47612 | Takada | Joetsu-shi, Niigata | 37°06.4′ | 138°14.8′ | 13 |
| 47616 | Fukui | Fukui-shi, Fukui | 36°03.3′ | 136°13.3′ | 9 |
| 47629 | Mito | Mito-shi, Ibaraki | 36°22.9′ | 140°28.1′ | 29 |
| 47626 | Kumagaya | Kumagaya-shi, Saitama | 36°09.0′ | 139°22.8′ | 30 |
| 47674 | Katsuura | Katsuura-shi, Chiba | 35°09.0′ | 140°18.7′ | 12 |
| 47678 | Hachijojima | Hachijo-machi, Hachijojima, Tokyo | 33°07.3′ | 139°46.7′ | 152 |
| 47640 | Kawaguchiko | Fujikawaguchiko-machi, Minamitsuru-gun, Yamanashi | 35°30.0′ | 138°45.7′ | 860 |
| 47656 | Shizuoka | Shizuoka-shi, Shizuoka | 34°58.6′ | 138°24.2′ | 14 |
| 47636 | Nagoya | Nagoya-shi, Aichi | 35°10.1′ | 136°57.9′ | 51 |
| 47663 | Owase | Owase-shi,Mie | 34°04.2′ | 136°11.6′ | 15 |
| 47795 | Mihama | Mihama-cho, Hidaka-gun, Wakayama | 33°53.6′ | 135°07.5′ | 9 |
| 47746 | Tottori | Tottori-shi, Tottori | 35°31.9′ | 134°12.0′ | 6 |
| 47755 | Hamada | Hamada-shi, Shimane | 34°53.8′ | 132°04.2′ | 20 |
| 47891 | Takamatsu | Takamatsu-shi, Kagawa | 34°19.1′ | 134°03.2′ | 9 |
| 47893 | Kochi | Kochi-shi, Kochi | 33°34.1′ | 133°33.0′ | 3 |
| 47898 | Shimizu | Tosashimizu-shi, Kochi | 32°43.4′ | 133°00.6′ | 31 |
| 47800 | Izuhara | Tsushima-shi, Nagasaki | 34°09.2′ | 129°13.4′ | 130 |
| 47805 | Hirado | Hirado-shi, Nagasaki | 33°21.6′ | 129°33.1′ | 58 |
| 47815 | Oita | Oita-shi, Oita | 33°14.2′ | 131°37.2′ | 5 |
| 47819 | Kumamoto | Kumamoto-shi, Kumamoto | 32°48.8′ | 130°42.4′ | 38 |
| 47822 | Nobeoka | Nobeoka-shi, Miyazaki | 32°34.9′ | 131°39.5′ | 19 |
| 47848 | Ichiki | Ichikikushikino-shi, Kagoshima | 31°42.5′ | 130°19.3′ | 25 |
| 47836 | Yakushima | Yakushima-cho, Kumage-gun, Kagoshima | 30°23.0′ | 130°39.5′ | 36 |
| 47909 | Naze* | Amami-shi, Kagoshima | 28°23.1′ | 129°29.7′ | 5 |
| 47945 | Minamidaitojima | Minamidaito-son, Shimajiri-gun, Okinawa | 25°49.8′ | 131°13.7′ | 16 |
| 47912 | Yonagunijima | Yonaguni-cho, Yaeyama-gun, Okinawa | 24°28.0′ | 123°00.6′ | 30 |
*Naze Observation Station was relocated on December 20, 2024.
(Latitude and longitude coordinates conform to the World Geodetic System.)
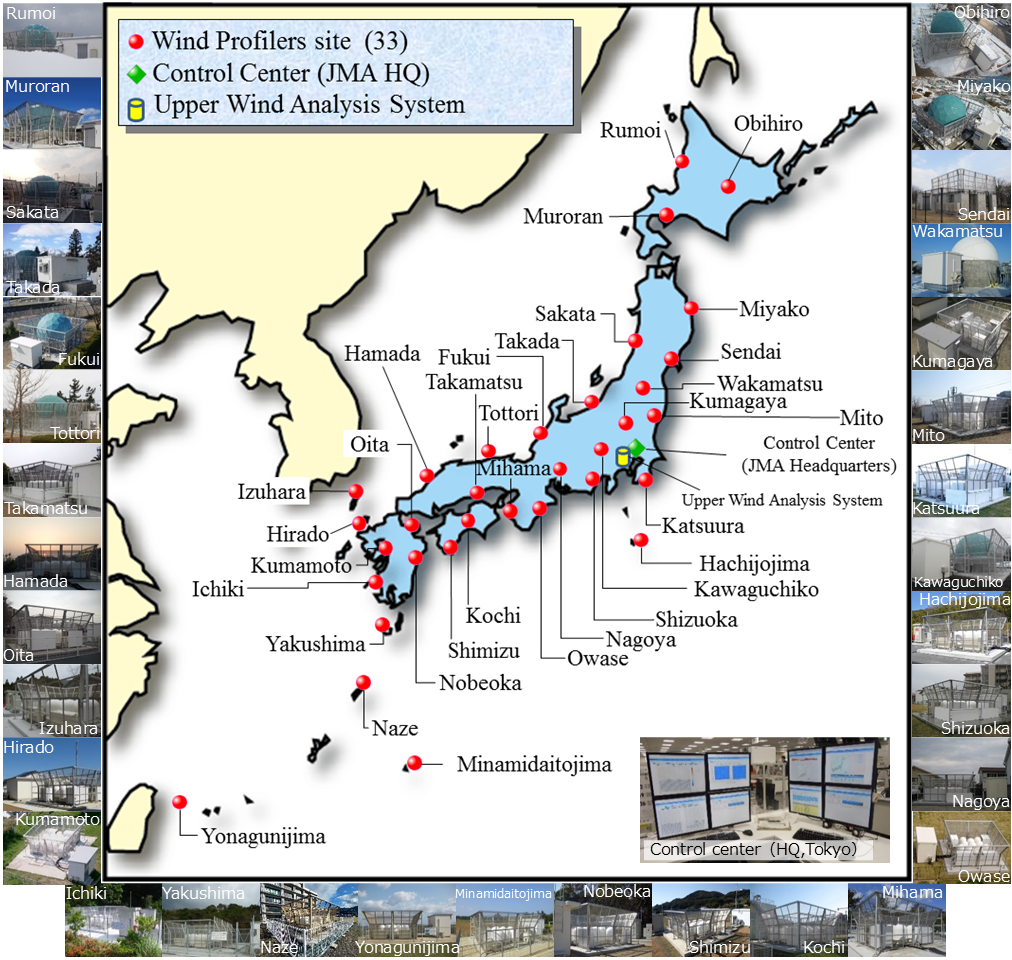
Wind profiler observation network (as of April 2014)
Examples of Wind Profiler
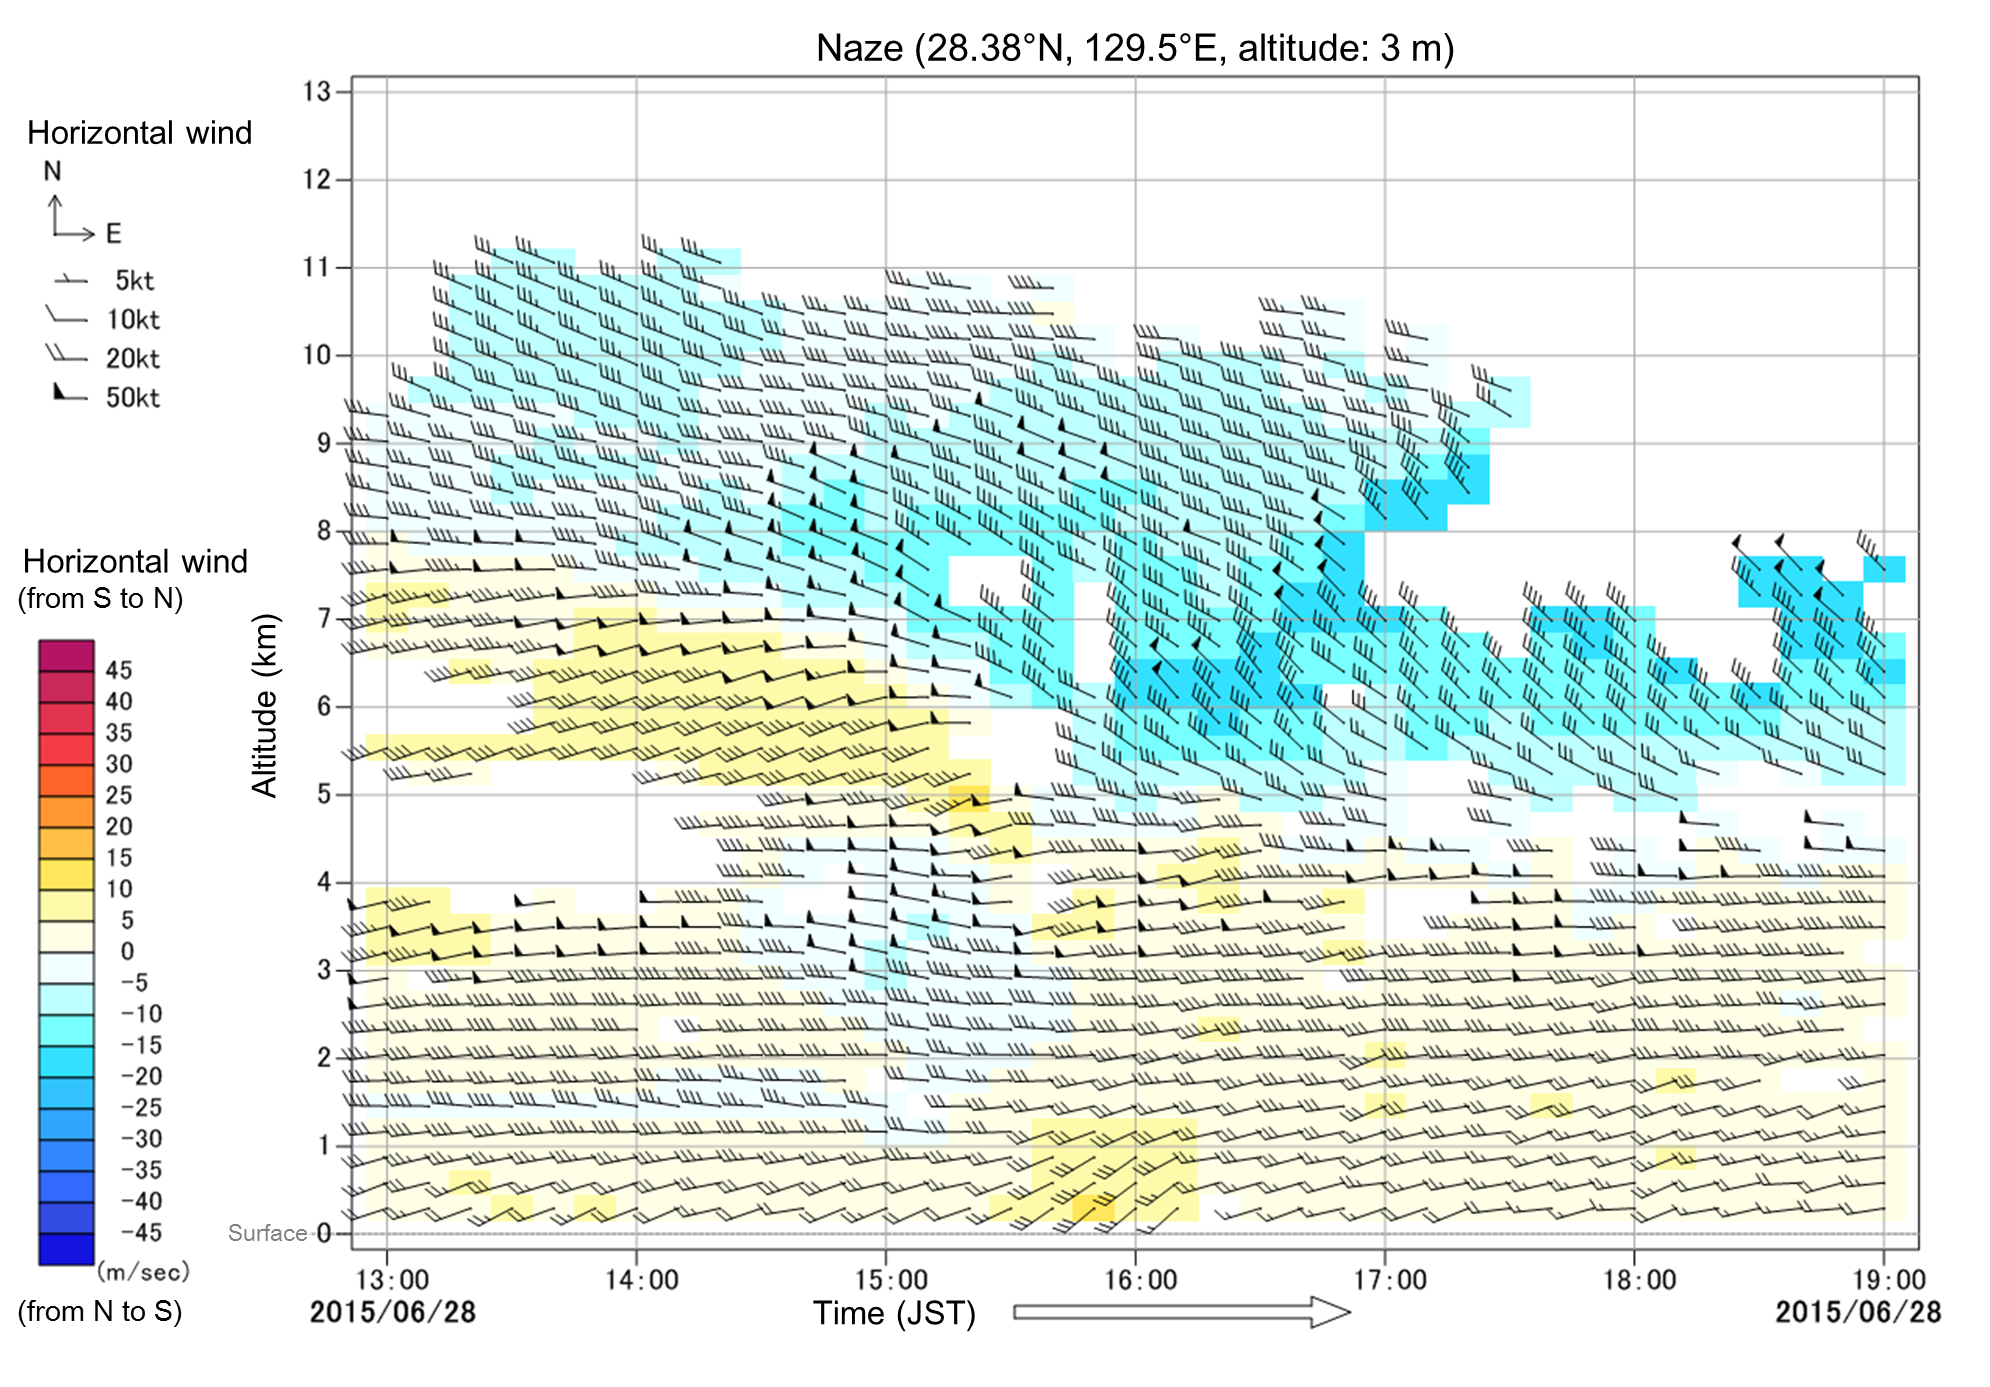
Passage of pressure ridges/troughs
Wind profiler data provide a picture of passing upper-air pressure ridges and troughs. As pressure ridges pass from west to east, the wind direction gradually changes from northwest to southwest; as troughs pass in the same direction, it gradually changes from southwest to northwest.
Processing and utilization of observation data
Upper-air pressure trough passage
Upper: Wind profiler data from Naze station 13:00 – 19:00 JST, 28 June 2015*
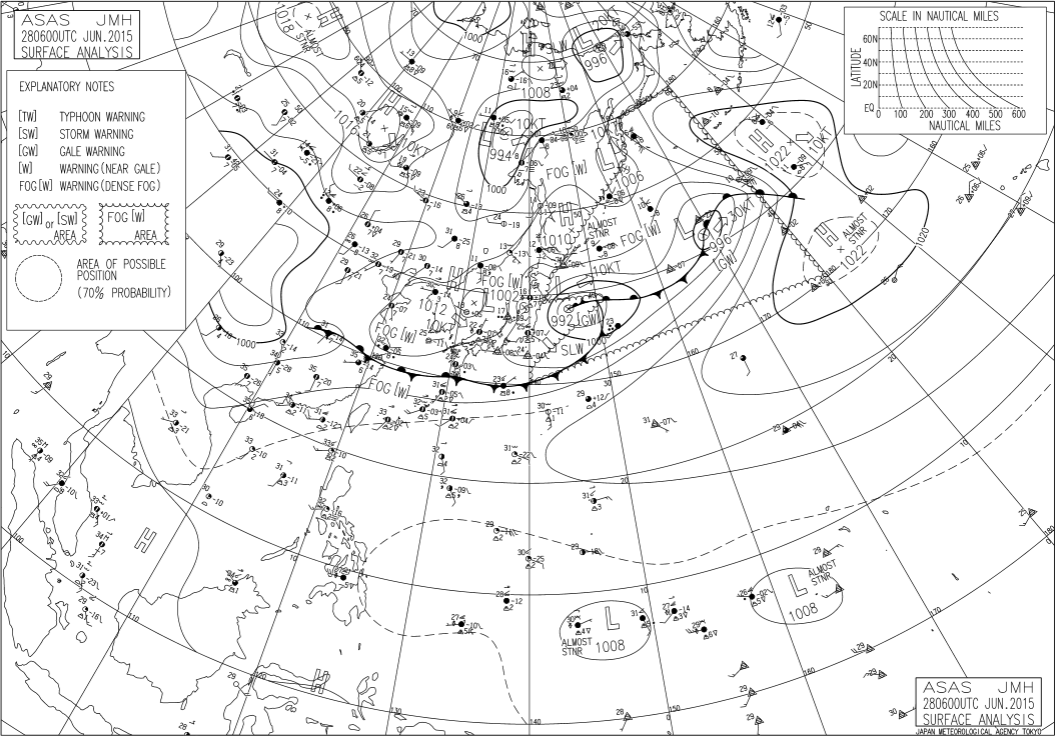
Bottom: Weather map 15:00 JST, 28 June 2015
*The legend in the figure on the upper represents westerly winds (i.e., from left to right in the figure). Warm colors represent southerly winds (south to north), while cold colors represent northerly winds (north to south).
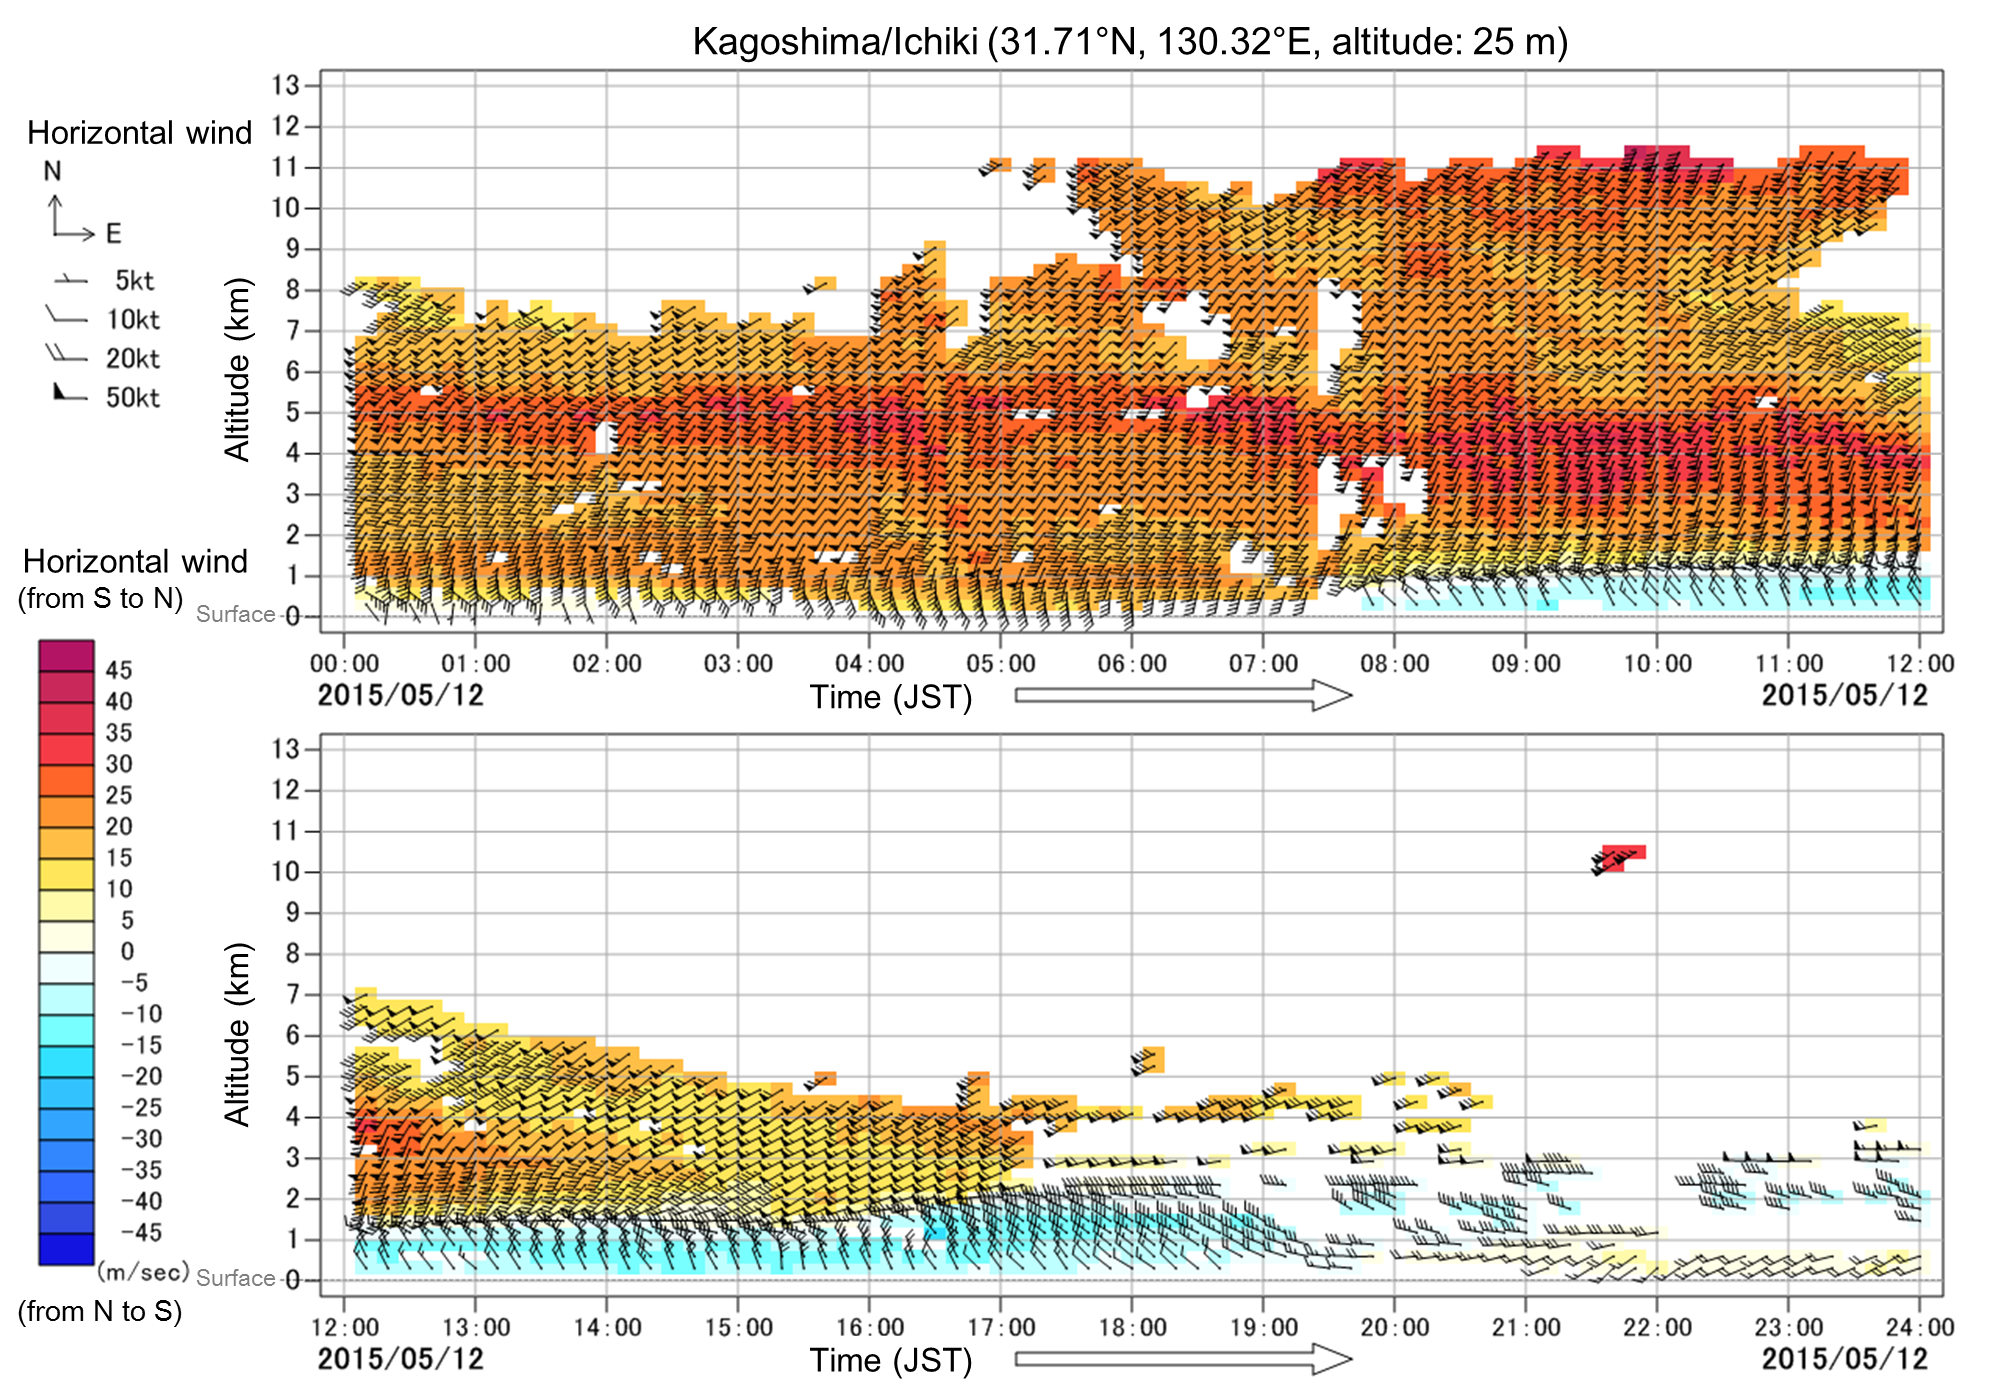
Passage of fronts
Wind profiler data provide a picture of passing fronts and their three-dimensional structure. As warm fronts pass, the wind direction gradually changes to southerly; as cold fronts pass, it gradually changes to northerly.
Processing and utilization of observation data
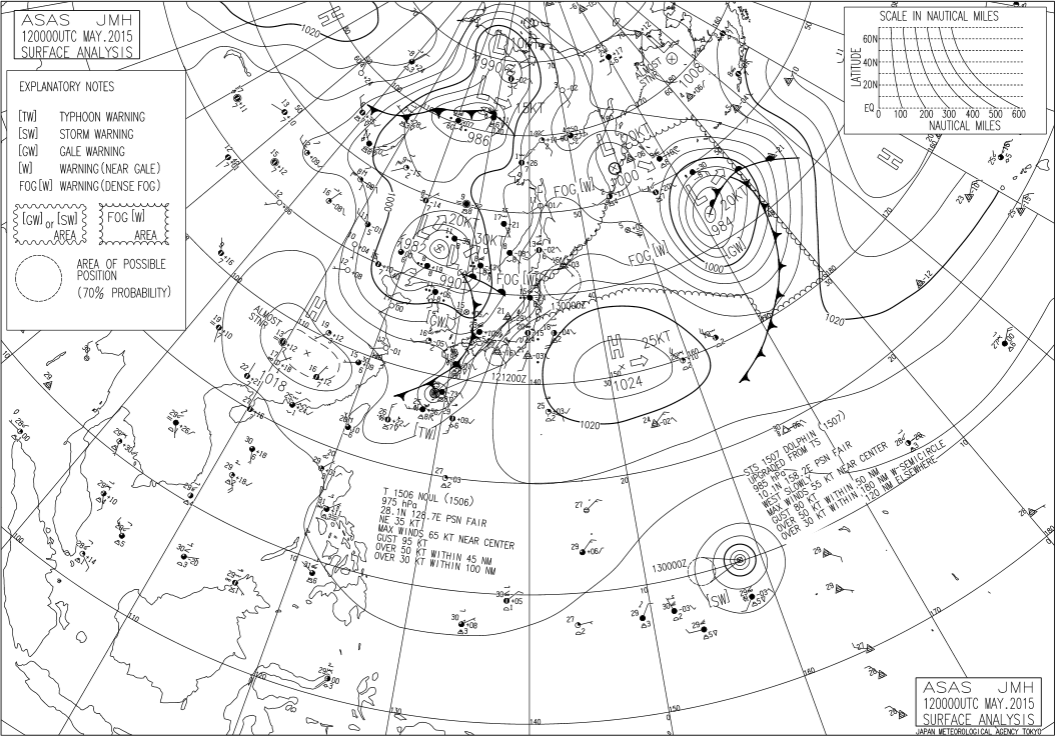
Cold-front passage Upper: Wind profiler data from Ichiki station 0:00 – 24: 00 JST, 12 May 2015* Lower: Weather map 9:00 JST, 12 May 2015
*The legend in the figure on the upper represents westerly winds (i.e., from left to right in the figure). Warm colors represent southerly winds (south to north), while cold colors represent northerly winds (north to south).
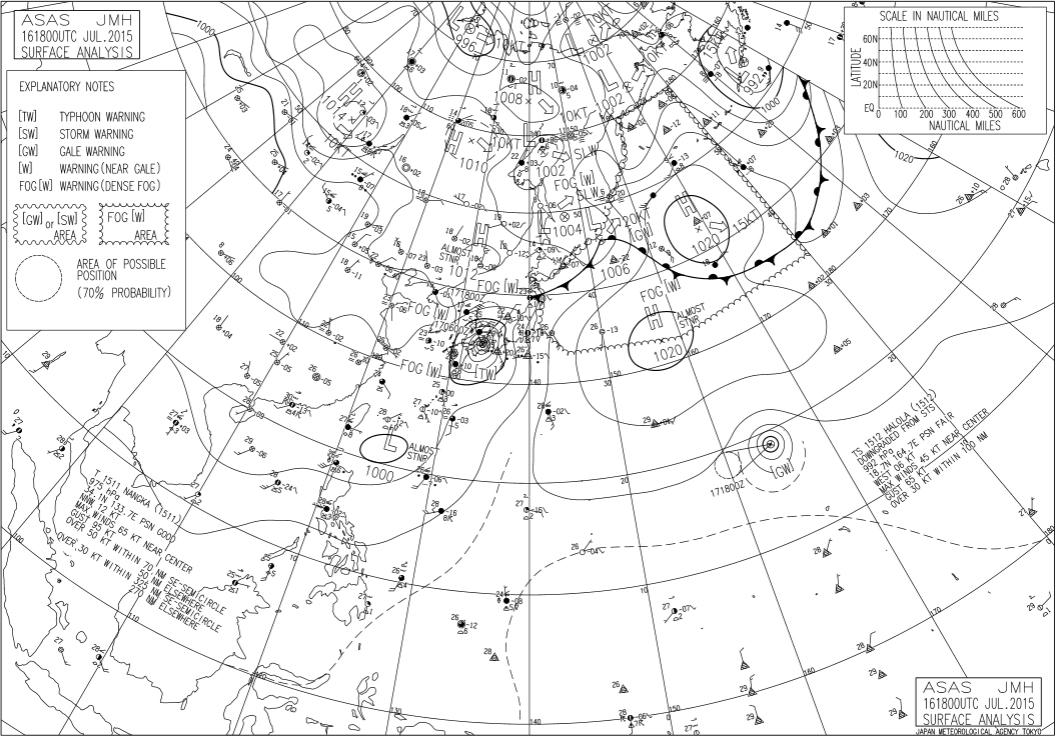
Passage of typhoons (tropical cyclones)
Wind profiler data help to clarify the central position and structure of typhoons. Wind moving counterclockwise indicates a typhoon passing to the east of the wind profiler station, while clockwise movement indicates passage to the west. The vertically homogeneous wind structure observed for typhoons maintaining strength tends to collapse when strength is lost (e.g., upon landfall).
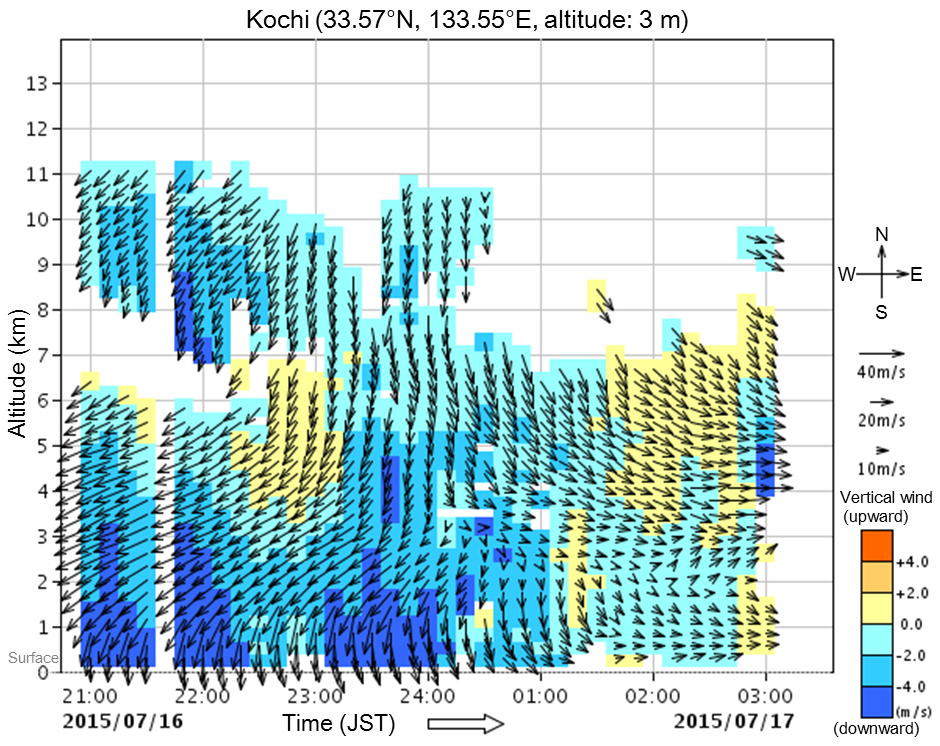
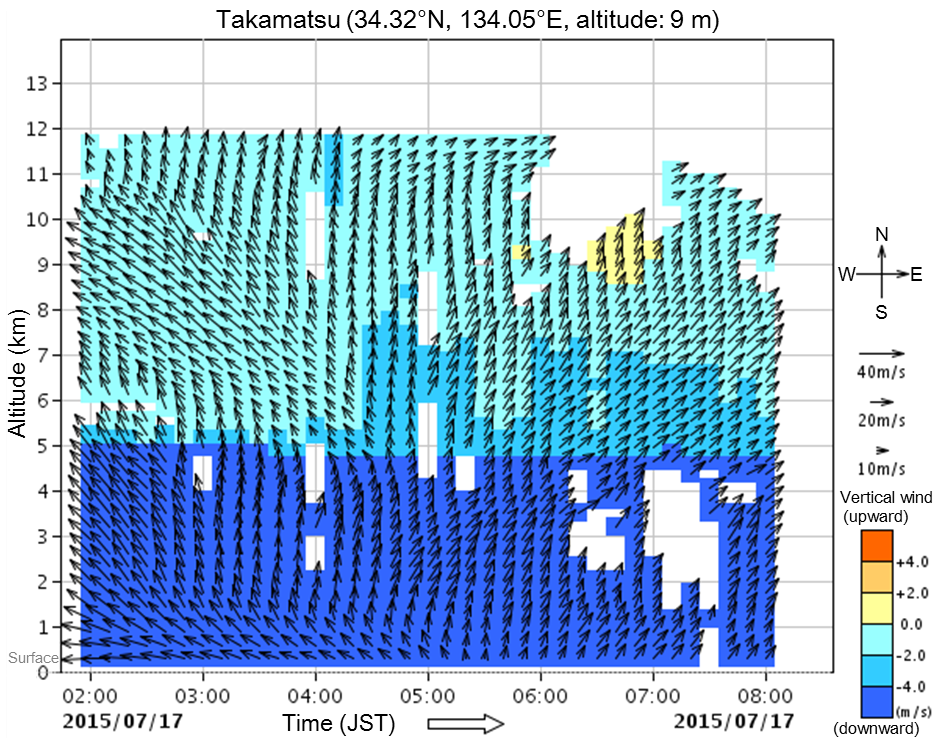
Typhoon passage
Upper left: Wind profiler data from Kochi station 21:00 16 – 3:00 JST, 17 July 2015
Upper right: Wind profiler data from Takamatsu station 2:00 – 8:00 JST, 17 July 2015
Lower: Weather map 3:00 JST, 17 July 2015
Notes on Observation Data
Dry atmospheric conditions make it difficult to obtain observation data from wind profilers because the accompanying turbulent density tends to be low. In addition, observation data obtained using wind profilers are checked in quality control processes. Blank areas on data charts correspond to dry-air regions or data removal in quality control.